First Light AcademyHELIOS PROVING GROUNDS / FLIGHT SCHOOL
FLIGHT ANALYSIS / PHYSICS CLUSTERS
Three cases. One justified decision at a time.
Three independent cases from Empires of a Shattered Sky
Use the evidence in each case to make a justified decision. Show an equation before substitution, include units, and explain your reasoning. Use a calculator in degree mode. Keep unrounded values until the final answer. Each cluster is worth 20 points.
Draft responses stay in this browser. Nothing is submitted or graded.
CLUSTER 01 / 20 POINTS
Across the Breach
Scene and supplied evidence
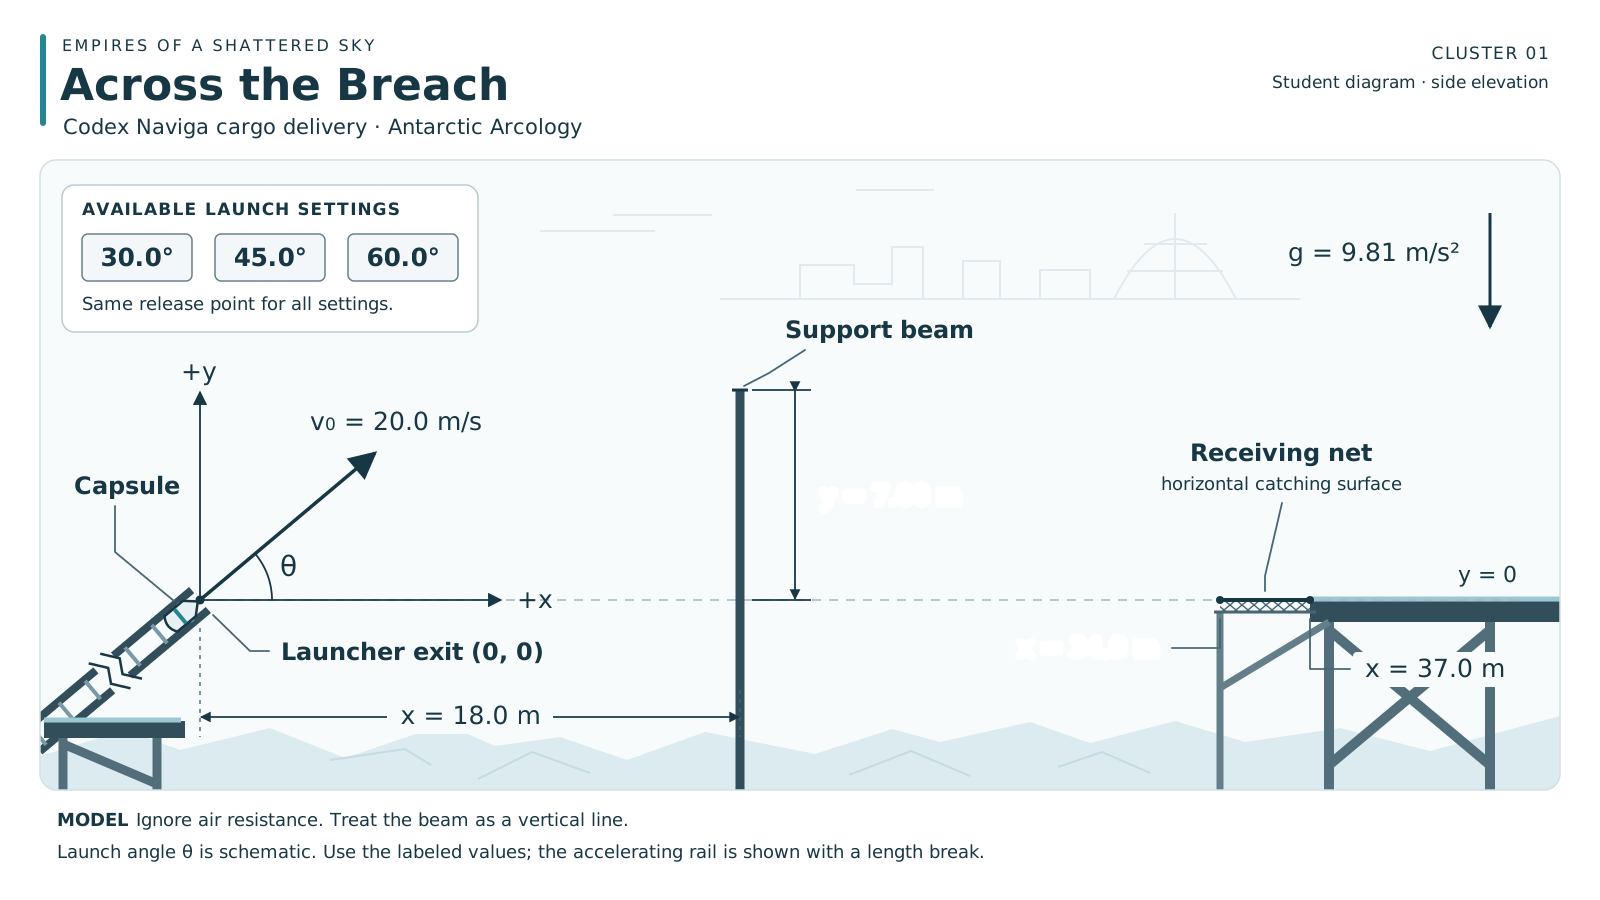
Scene 1 · Questions 1.1–1.8. Open the diagram for a larger view.
A damaged service bridge has isolated a maintenance annex near the Antarctic Arcology. A Codex Naviga repair crew must send a protected communications module across the gap. Their delivery drone is disabled, so they use a cargo launcher with three angle settings. The capsule accelerates along a straight rail and then moves freely through the air. A raised support beam obstructs the route, and a horizontal receiving net covers a narrow landing zone on the far side. Your task is to choose a launch setting that clears the beam and reaches the net.
Model: Treat the capsule as a particle. Ignore air resistance, wind, and Earth curvature. After release, ax = 0 and ay = -9.81 m/s². The release point is (0, 0); right and up are positive. The receiving net is at y = 0. All angles are measured above horizontal.
Site or launcher measurement
Value
Available launch angles
30.0°, 45.0°, 60.0°
Speed at release for every setting
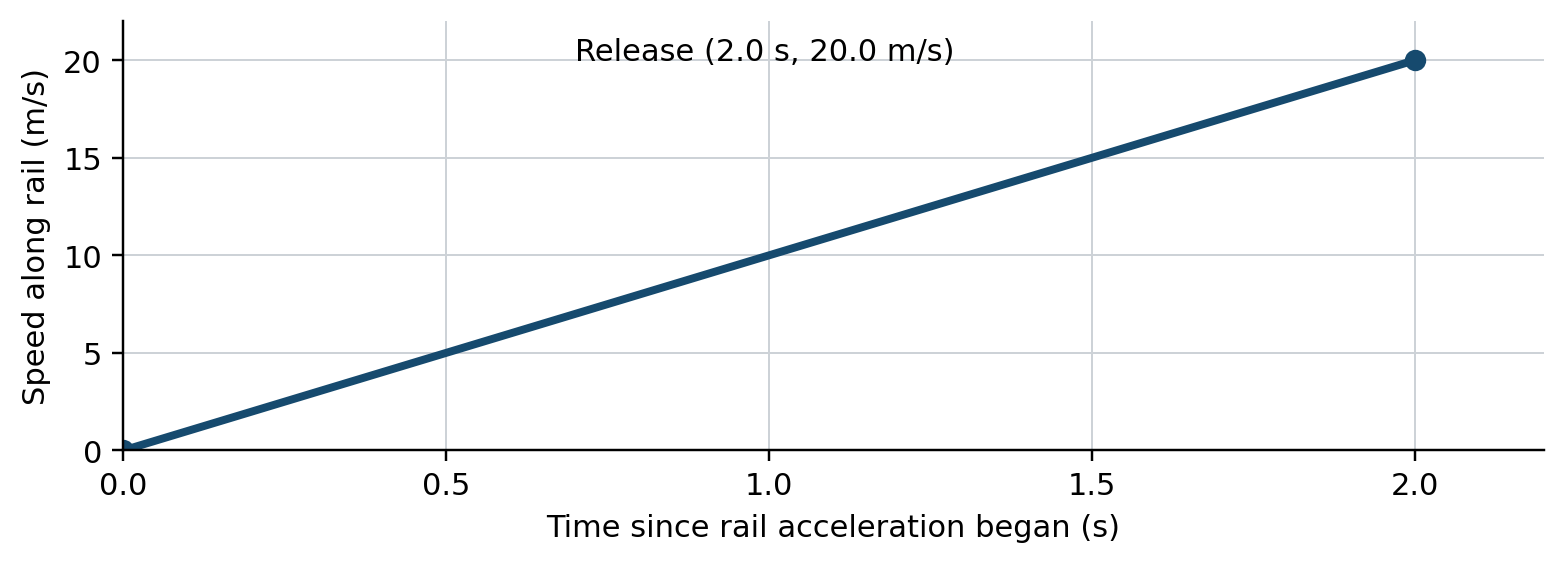
20.0 m/s
Initial speed on rail
0 m/s
Receiving net horizontal extent
x = 34.0 m to 37.0 m
Beam location and top height
x = 18.0 m; y = 7.00 m
Graph 1: Rail speed rises linearly from 0 m/s at 0 s to 20.0 m/s at 2.00 s.
Graph 1. The line is straight. Its time origin is the start of rail acceleration; projectile time begins again at zero at release.
Cluster 1 Motion evidence
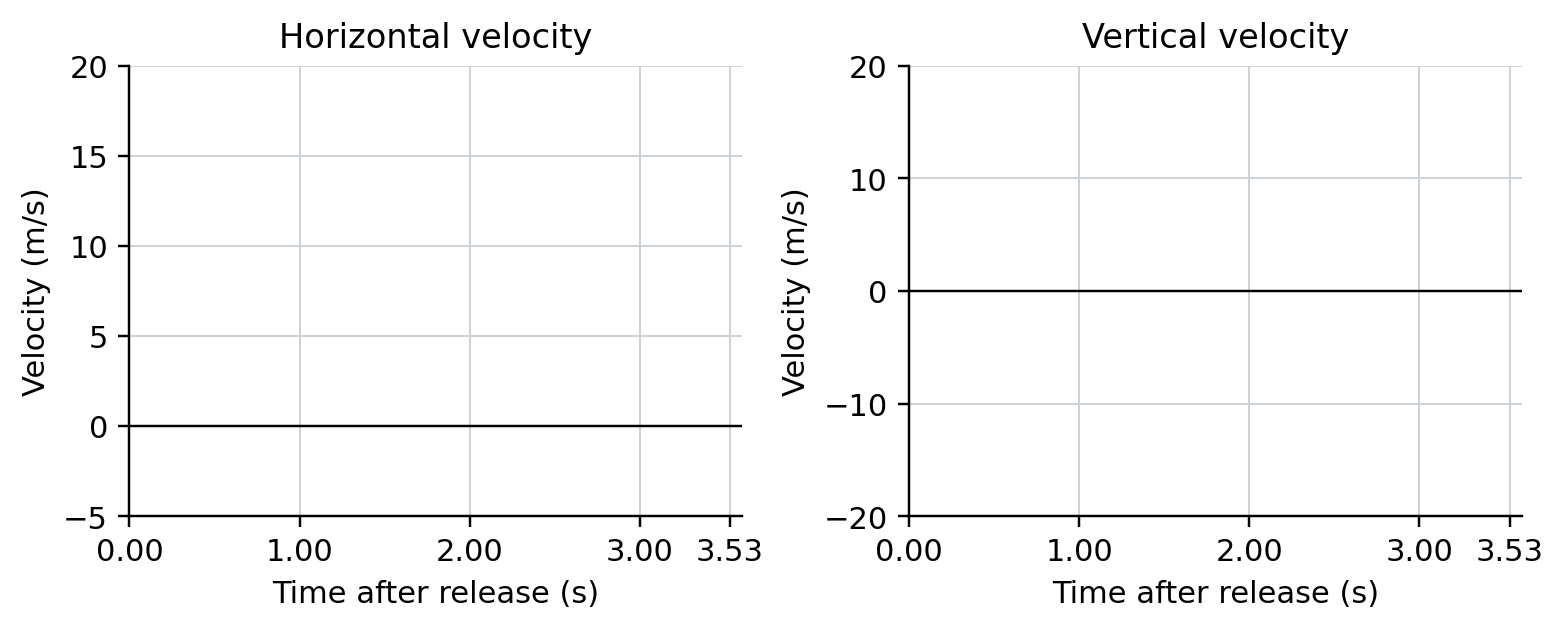
Blank horizontal-velocity and vertical-velocity axes for item 1.4; time runs from 0 to 4 seconds.
Cluster 1 The delivery decision
The crew’s model gives these results for the other settings. The predicted range assumes no obstruction.
Launch angle
Predicted range
Height at x = 18.0 m
30.0°
35.3 m
5.10 m
45.0°
40.8 m
10.1 m
CLUSTER 02 / 20 POINTS
Catch Without Breaking
Scene and supplied evidence
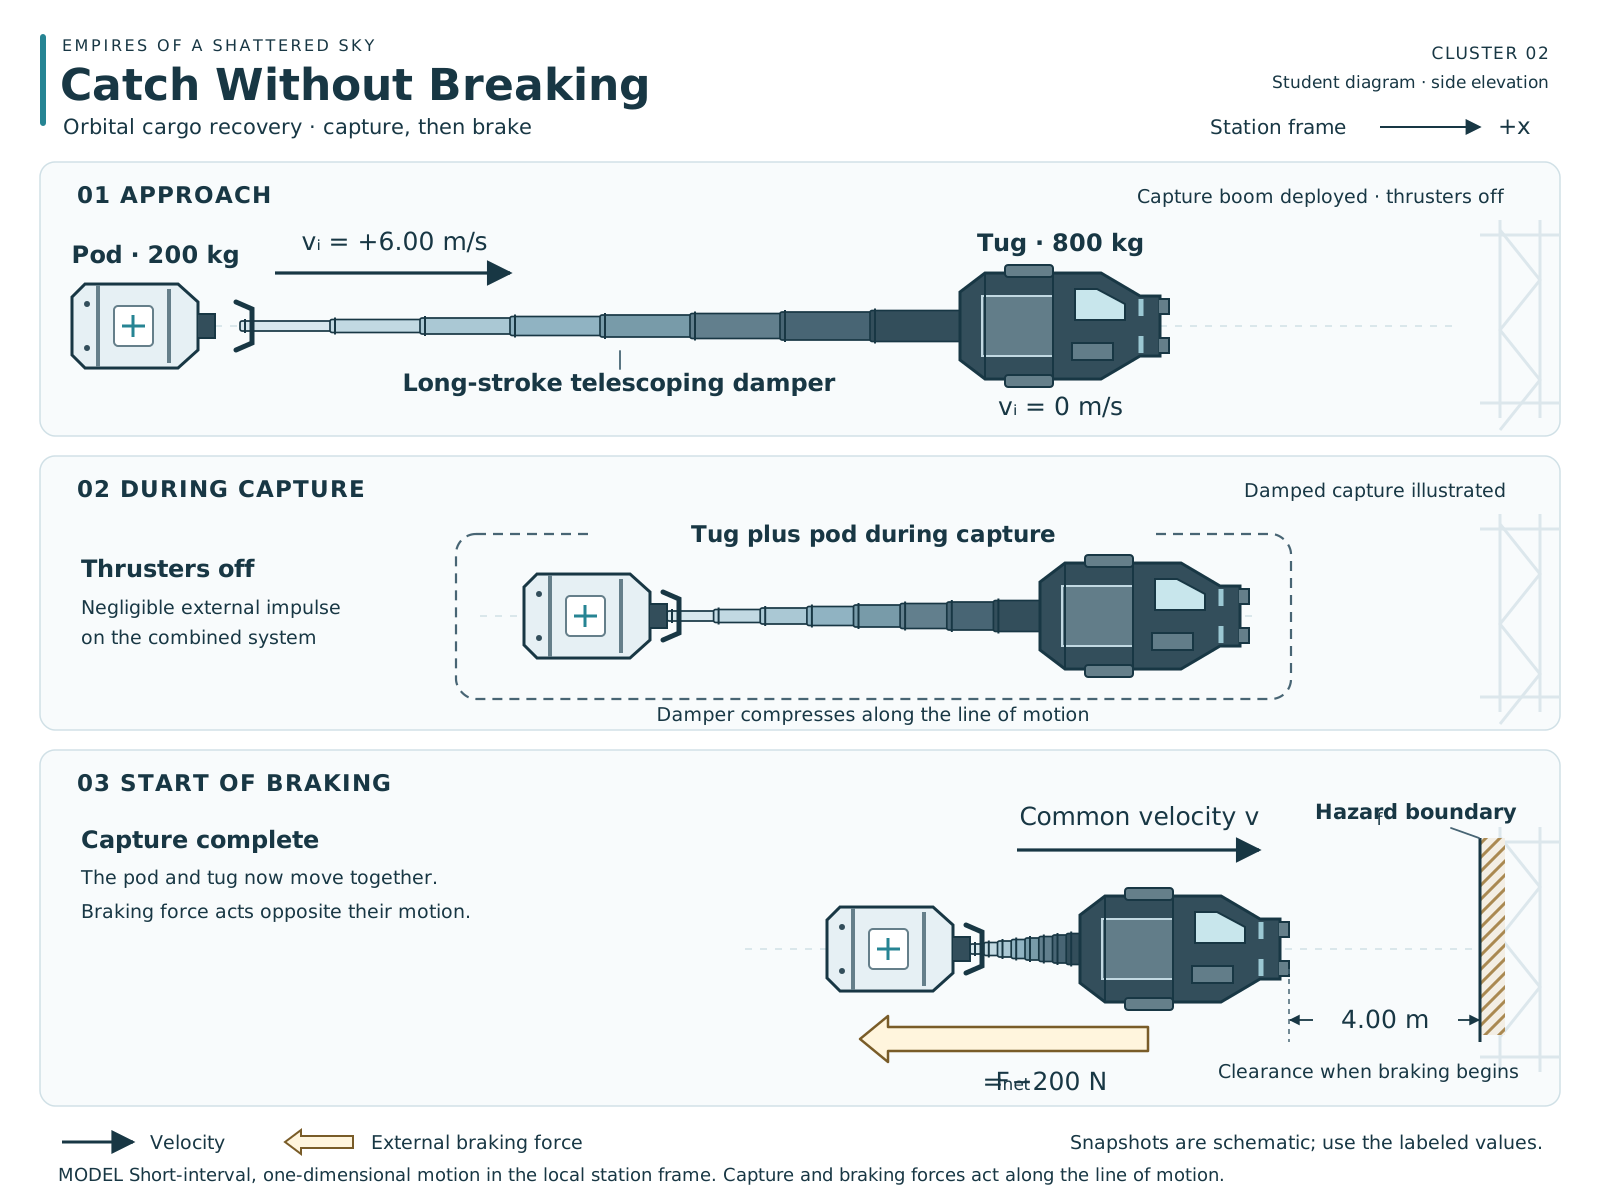
Scene 2 · Questions 2.1–2.8. Open the diagram for a larger view.
A cargo pod has broken loose near a Codex Naviga orbital transfer station. A recovery tug waits ahead of it with its capture system aligned through both centers of mass. The pilot can use a rapid locking mechanism or a damped mechanism that gradually brings the tug and pod to a common velocity. Thrusters remain off during capture. After capture, the pilot uses a braking thruster to stop both objects relative to the station. Choose a capture method and evaluate whether the combined system can stop safely.
Model: Use a local frame moving with the station over this short interaction. Motion is one-dimensional; right is positive. Neglect external impulse and differences in gravitational acceleration during capture. Ignore rotation. After capture the tug and pod remain connected. Thruster propellant loss is negligible.
Measured or specified quantity
Value
Pod mass and initial velocity
200 kg; +6.00 m/s
Tug mass and initial velocity
800 kg; 0 m/s
Maximum allowable coupling force
1,000 N
Net braking force after capture
-200 N
Clear stopping distance at start of braking
4.00 m
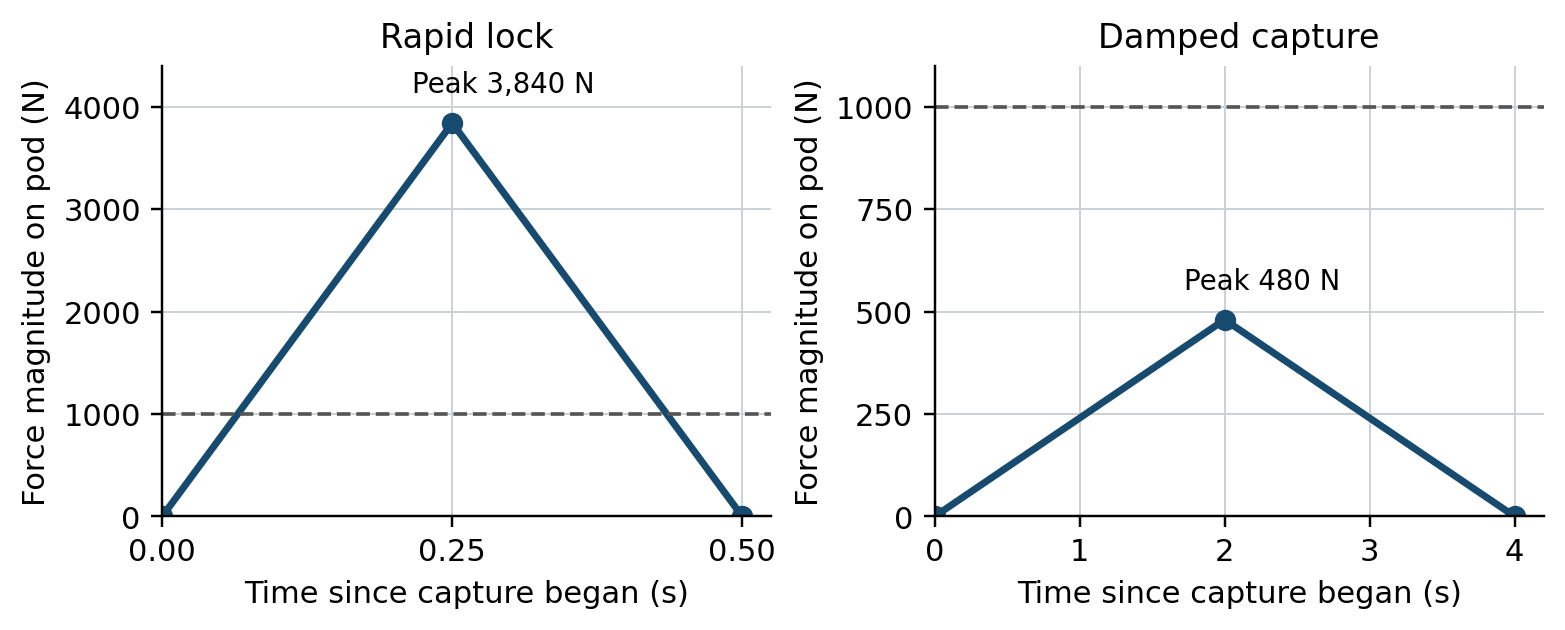
Graph 2: Rapid-lock triangular force pulse lasts 0.500 s and peaks at 3840 N. Damped pulse lasts 4.00 s and peaks at 480 N. Dashed coupling limit is 1000 N. Force on the pod acts left; the panels have different scales.
Graph 2. Each pulse is a straight-sided triangle. Both graphs show the magnitude of the force on the pod; its direction is left. The dashed line is the coupling limit. The two panels use different time and force scales.
Cluster 2 Capture analysis
Cluster 2 Equipment and braking decisions
CLUSTER 03 / 20 POINTS
Shutdown Is Not Enough
Scene and supplied evidence
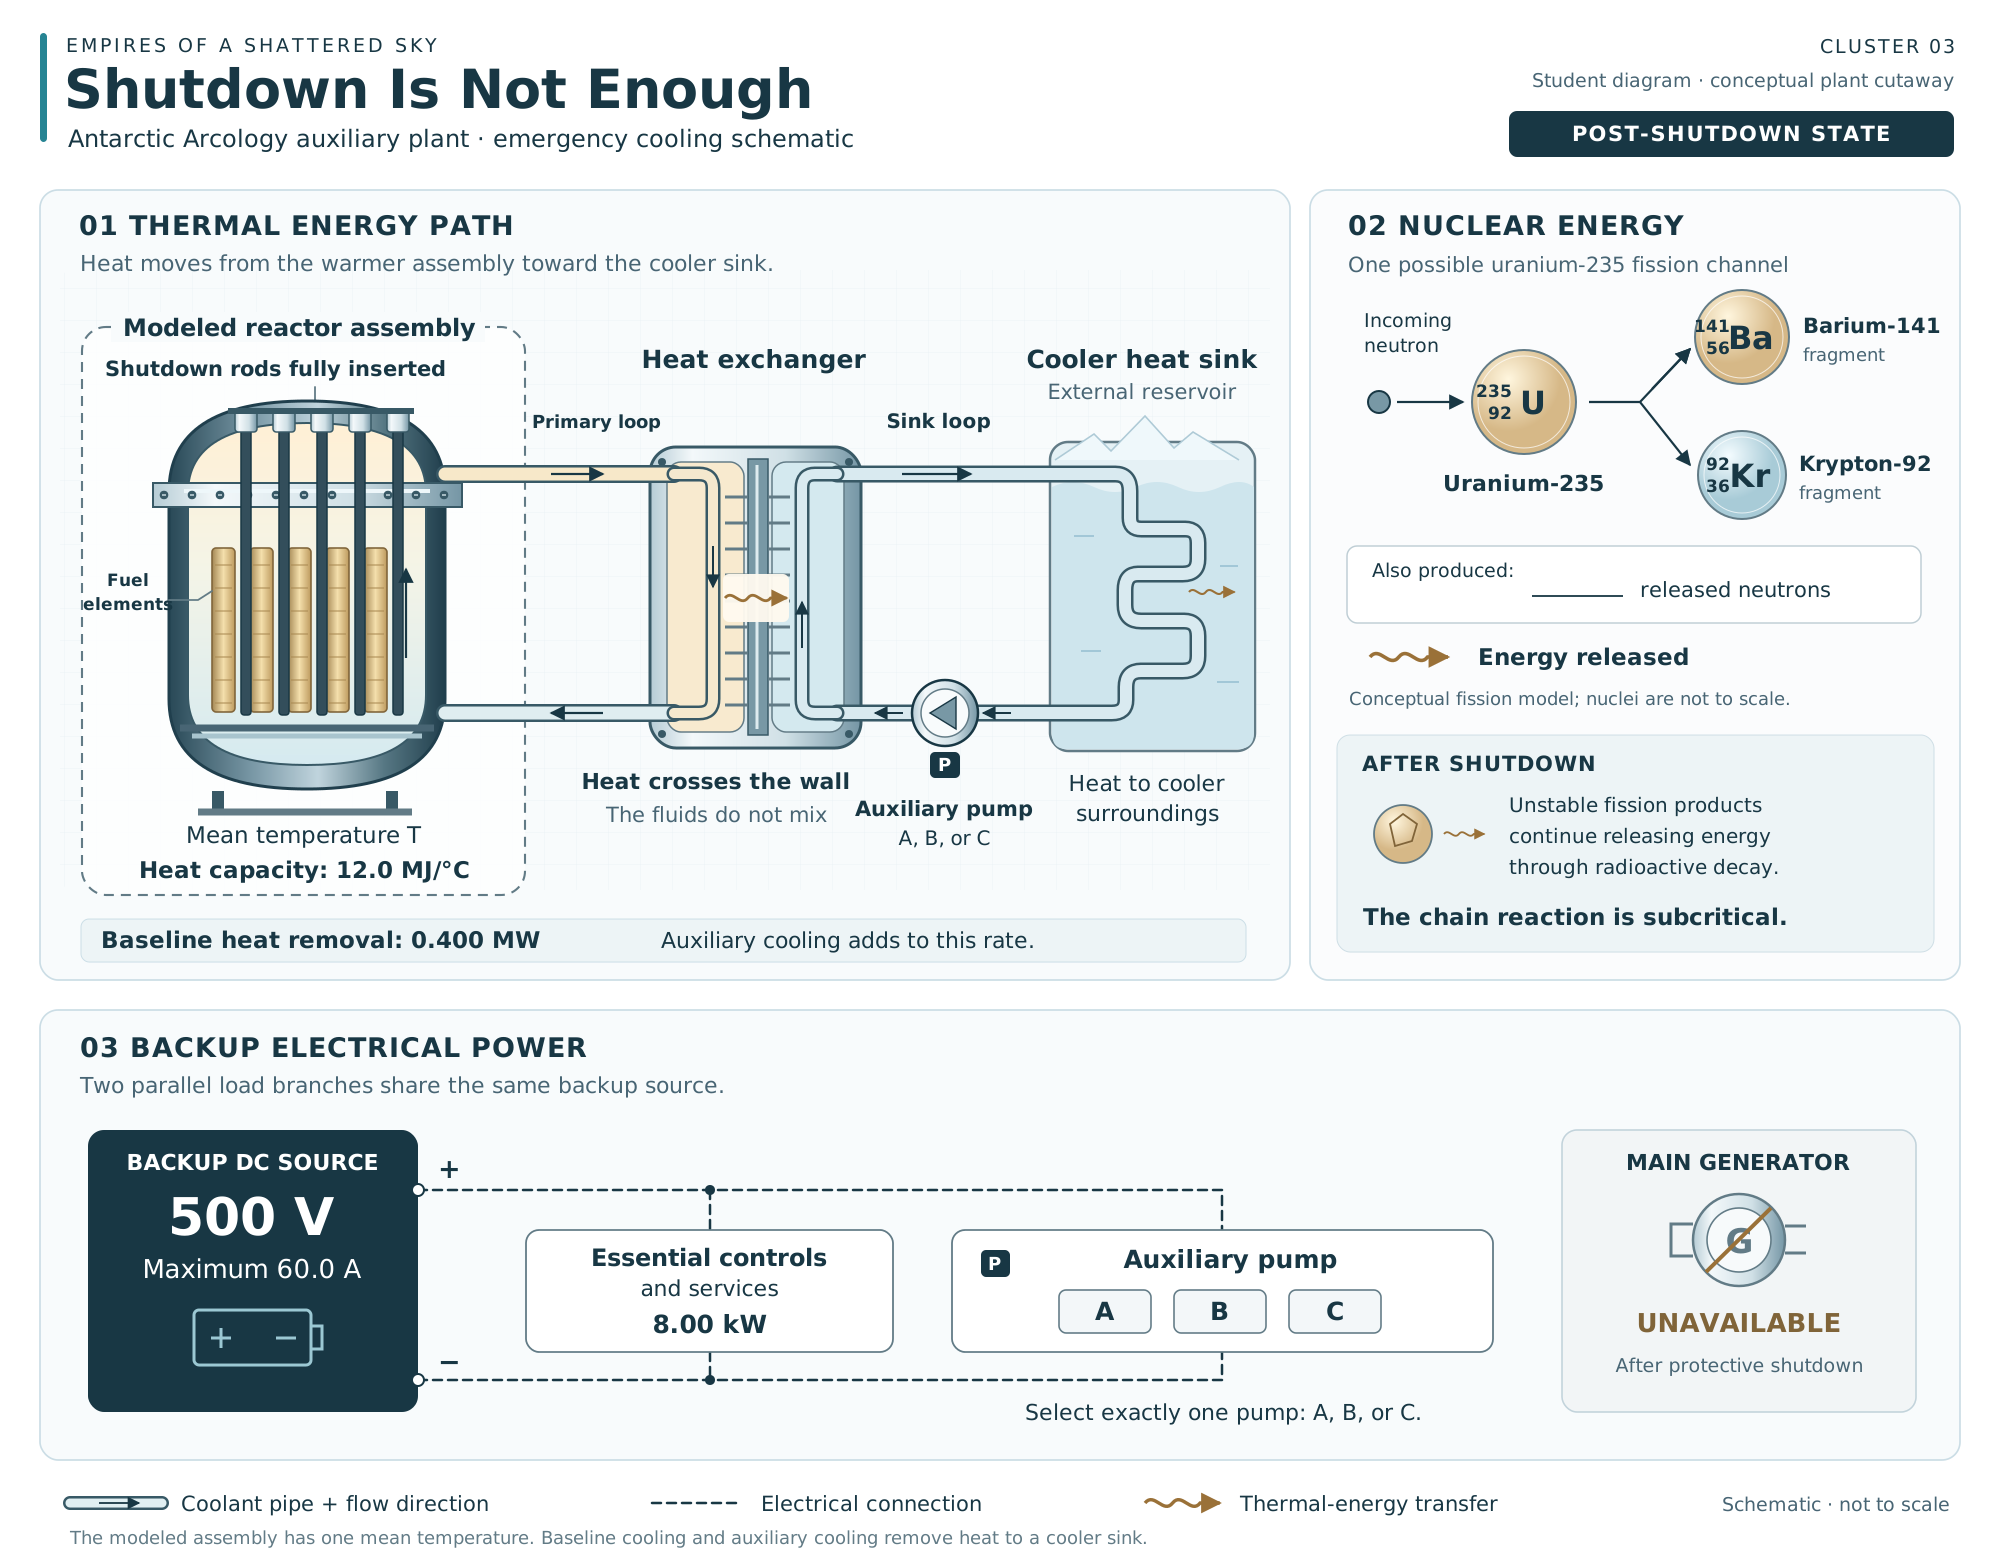
Scene 3 · Questions 3.1–3.8. Open the diagram for a larger view.
An equipment fault at an auxiliary fission plant serving the Antarctic Arcology causes an unintended power increase and disrupts normal cooling. The protective shutdown stops the sustained chain reaction. The main generator is unavailable, but the reactor assembly continues to warm. An engineering crew has a backup electrical supply and three auxiliary pumps. You must explain the continuing heat production and choose a pump that removes enough heat without overloading the backup supply.
Science briefing: A critical reactor has a self-sustaining chain reaction; the term does not itself mean overheating. Shutdown makes the chain reaction subcritical. Unstable fission products continue to decay and release energy. The remaining heat must still be transferred to cooler surroundings.
Quantity
Scenario value
Normal thermal power before the fault
20.0 MW
Normal electrical output before the fault
6.00 MW
Mean assembly temperature at monitoring time t = 0
305 °C
Effective heat capacity C of modeled assembly
12.0 MJ/°C
Maximum permitted mean temperature in this scenario
320 °C
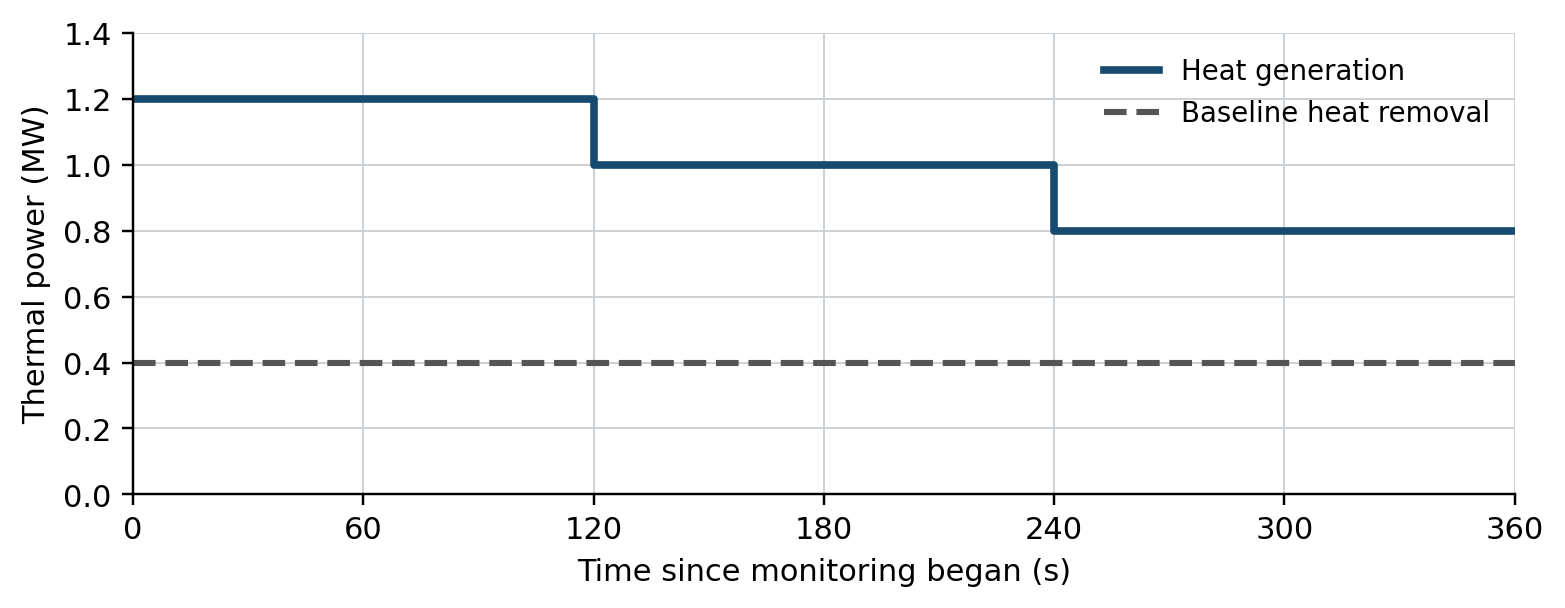
Graph 3: Heat generation is 1.20 MW from 0 to 120 s, 1.00 MW from 120 to 240 s, and 0.800 MW from 240 to 360 s. Baseline heat removal is 0.400 MW throughout.
Graph 3. Monitoring begins shortly after shutdown. Use constant heat generation of 1.20 MW for 0–120 s, 1.00 MW for 120–240 s, and 0.800 MW for 240–360 s. Baseline heat removal is 0.400 MW throughout. These are simplified interval averages.
Cluster 3 Nuclear and cooling evidence
Thermal model: Treat the reactor assembly as one uniform-temperature system with constant heat capacity. There is no phase change. The listed heat-removal rates include all modeled cooling and are net of pump heating. Use ΔE = (Pgenerated - Premoved)Δt and ΔT = ΔE/C. Here 1 MW = 1 MJ/s. The heat sink remains cooler than the assembly.
At t = 120 s, exactly one auxiliary pump can start and remain on until t = 360 s. Its additional heat removal adds to the 0.400 MW baseline. Rates are constant over this short interval. The backup source maintains 500 V and can supply at most 60.0 A. Essential controls and services require 8.00 kW continuously. Treat the listed currents as steady operating currents; ignore start-up transients.
Pump
Supply voltage
Current
Additional net thermal removal
A
500 V
20.0 A
0.300 MW
B
500 V
40.0 A
0.700 MW
C
500 V
70.0 A
1.10 MW
Nuclear model data: A uranium-235 nucleus has 92 protons; barium has 56 protons and krypton has 36. A neutron has mass number 1 and charge 0. One possible fission channel is represented below; mass numbers appear after the element names.
neutron + uranium-235 → barium-141 + krypton-92 + ____ neutrons + released energy
Cluster 3 Energy and temperature predictions
Monitoring time
Mean assembly temperature
0 s
305 °C
120 s
240 s
360 s
Cluster 3 The cooling decision
Pump
Pump electrical power
Total with essential loads
A
B
C
All measurements and equipment specifications are fictional instructional data. Use the scene diagrams, graphs, and stated model together.